基于Excel数据使用Python+Echarts展示数据
技术:Python3.8 + Flask + Echarts
概述
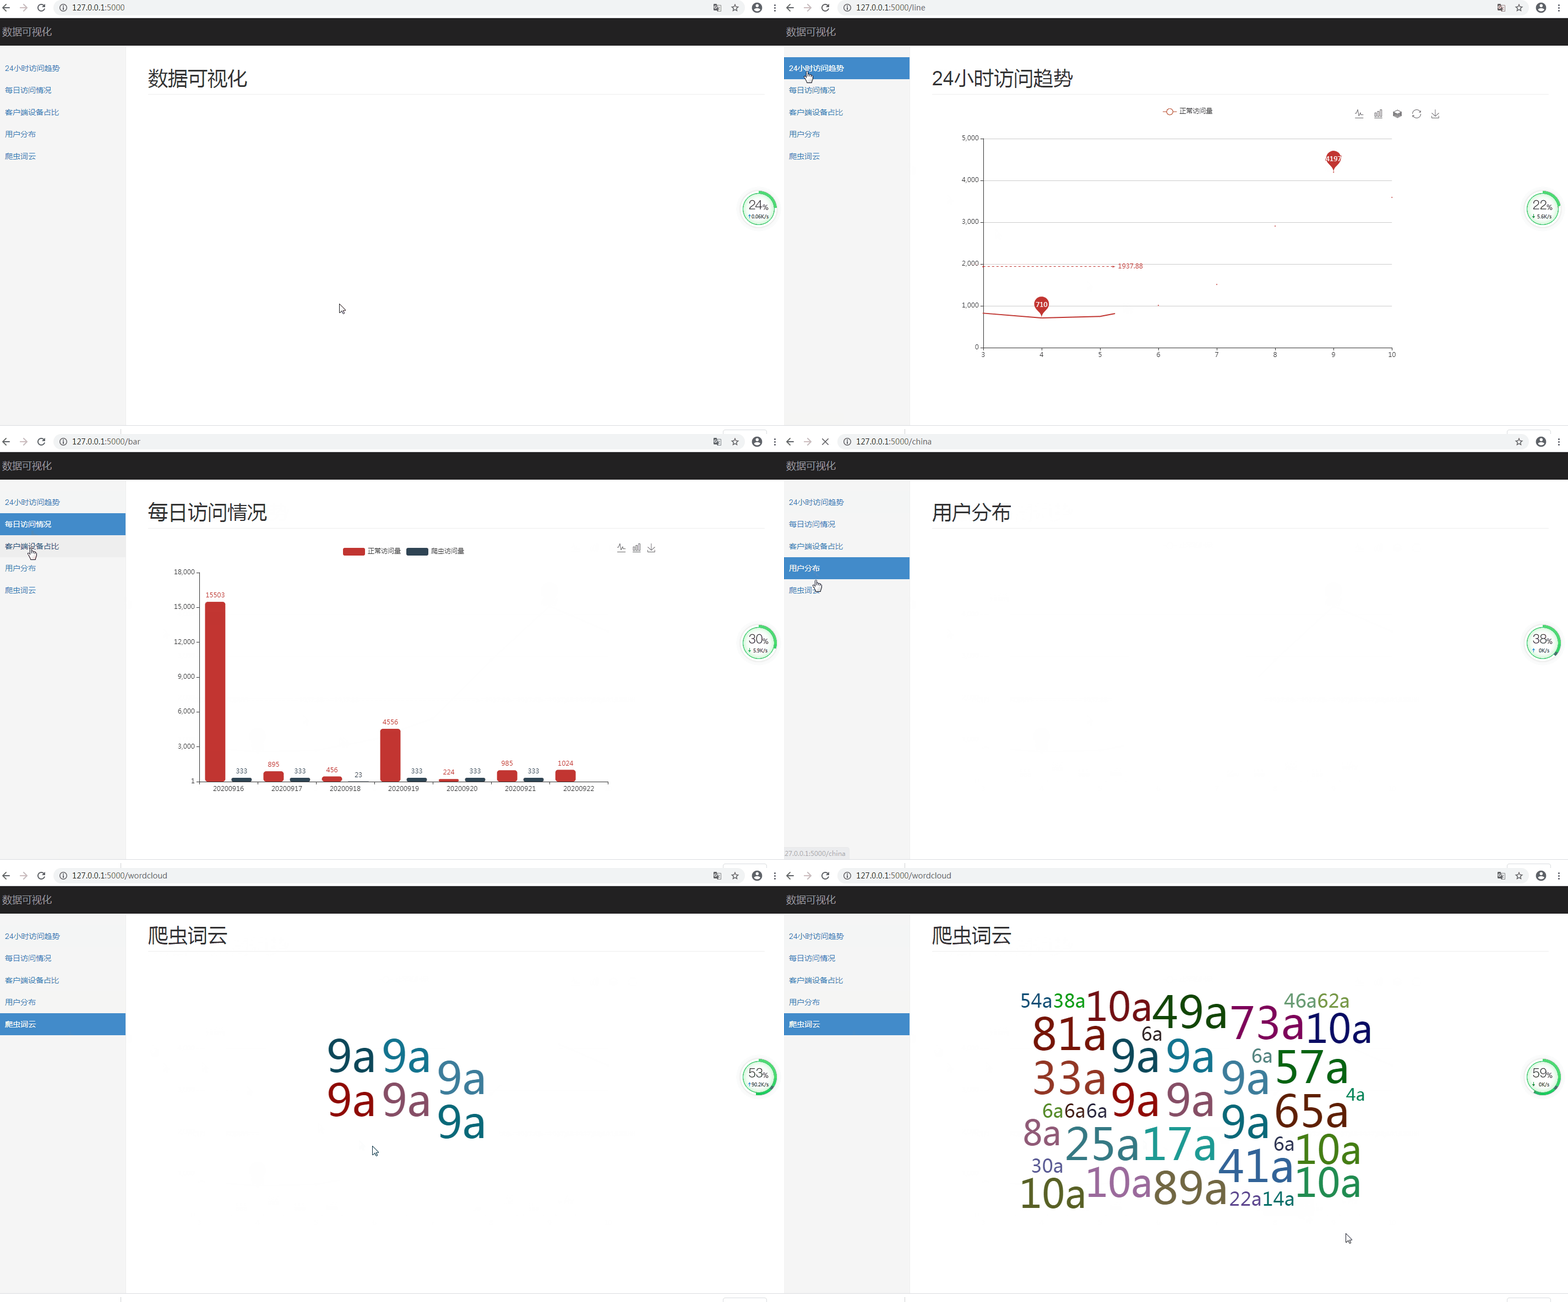
使用 Python 读取 Excel 数据,使用 Flask 作为 Web 框架, 使用 Echarts 作为图表展示
详细
一、运行效果

二、实现过程
① 安装必须的依赖
pip install -r requirements.txt

如果安装过程很慢:
修改安装源,可以参考:https://www.cnblogs.com/andy9468/p/9982154.html
② Excel数据格式如下,包含的多个 sheet 页签

③ 使用 pandas 读取 Excel 数据
import pandas as pd

filepath = "data.xlsx"#"分析结果.xlsx"

df2 = pd.read_excel(filepath, sheet_name='省份', header=None)

province_data = [{'name': row[0].strip(), 'value': row[1]} for row in df2.values]
# print(province_data)

df3 = pd.read_excel(filepath, sheet_name='按时', header=None)
line_legend = [row[0] for row in df3.values]
line_normal = [row[1] for row in df3.values]
④ 拼接json数据
from ironman.read_data import *
class SourceData:

    @property
    def china(self):
        return province_data

    @property
    def line(self):
        data = {
            '正常访问量': line_normal,
            # '爬虫访问量': line_normal,
            'legend': line_legend
        }
        return data
⑤ 使用 Flask 启动服务
import os
import sys

sys.path.append(os.path.dirname(os.path.abspath(__file__)) + '/../')

from flask import Flask, render_template
from ironman.data import SourceData
app = Flask(__name__)

source = SourceData()


@app.route('/')
def index():
    return render_template('index.html')


@app.route('/line')
def line():
    data = source.line
    xAxis = data.pop('legend')
    return render_template('line.html', title='24小时访问趋势', data=data, legend=list(data.keys()), xAxis=xAxis)
三、项目结构图
│  requirements.txt
│  tree.txt
│
├─.idea
│  │  .gitignore
│  │  EchartsExampleExcel.iml
│  │  misc.xml
│  │  modules.xml
│  │  workspace.xml
│  │
│  └─inspectionProfiles
│          profiles_settings.xml
│
└─ironman
    │  app.py
    │  data.py
    │  data.xlsx
    │  read_data.py
    │
    ├─static
    │  ├─css
    │  │      barrager.css
    │  │      bootstrap-theme.min.css
    │  │      bootstrap.min.css
    │  │      dashboard.css
    │  │      shCoreDefault.css
    │  │      style.css
    │  │
    │  └─js
    │          bootstrap.min.js
    │          china.js
    │          echarts-wordcloud.min.js
    │          echarts.js
    │          echarts.min.js
    │
    ├─templates
    │      bar.html
    │      china.html
    │      index.html
    │      layout.html
    │      line.html
    │      pie.html
    │      wordcloud.html
    │
    └─__pycache__
            data.cpython-38.pyc
            read_data.cpython-38.pyc
本实例支付的费用只是购买源码的费用,如有疑问欢迎在文末留言交流,如需作者在线代码指导、定制等,在作者开启付费服务后,可以点击“购买服务”进行实时联系,请知悉,谢谢
手机上随时阅读、收藏该文章 ?请扫下方二维码


