
Python爬取所有股票数据并进行数据分析


技术:python3.7
概述
一个可以爬取每只股票每分钟实时数据的python的demo,并进行简单的数据分析
详细
一、背景
作为一个程序员,总喜欢在股市里面晃荡,无奈总是当成韭菜收割了。每一次都是卖涨买跌,处处碰壁。但是作为一个有一定阅历的程序员本能告诉自己,只要掌握了大量的股票数据,就可以在信息渠道落后的情况下,分析出机构大概率的在布局哪些股票,从而在机构拉涨停之前,提前进入分一杯羹。于是,开始编写了爬取股票数据并进行数据分析的程序。
二、环境
Anaconda3.3 python3.7.1

三、目标
爬取所有股票每天每一分钟的数据,并且进行数据分析
四、实现过程以及最终效果图
爬虫结果图
数据展示图
五、程序代码解析(源代码下载地址及数据库文章底部会提供):
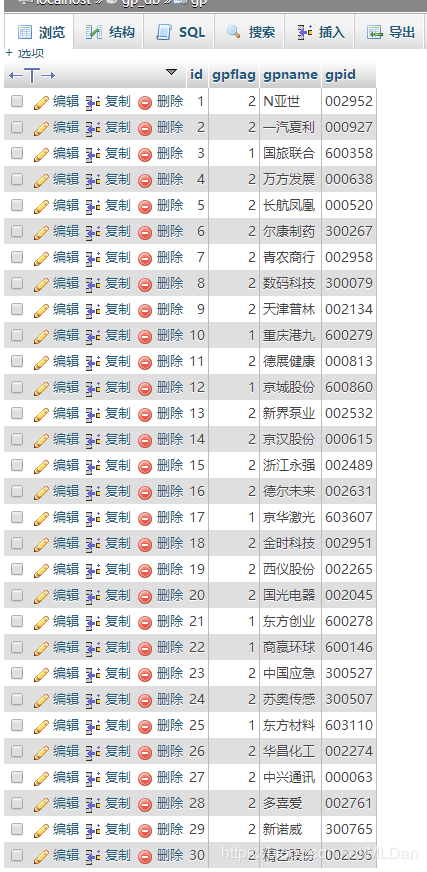
1、把所有股票的基本信息都保存在一个mysql数据库中gp.sql,总过三千六百多条,如下图:
2、获取股票当天所有的数据get_gp_detail.py:
import pymysql
import numpy as np
import sys
import json
import urllib.request
import urllib
import os
import time
#连接数据库
db = pymysql.connect(host='127.0.0.1',user='root',password='root',db='gp_db',port=3306)
#获取cursor
cursor = db.cursor()# 使用 execute() 方法执行 SQL,如果表存在则删除
sql = "select * from gp"
cursor.execute(sql)
print("SELECT OK")
#all_gp = cursor.fetchmany(1)
all_gp = cursor.fetchall() #从数据库中获取所有股票的基本信息数据
arr = np.array(all_gp) #转化为numpy数据格式
now = int(time.time())
#转换为其他日期格式,如:"%Y-%m-%d %H:%M:%S"
timeStruct = time.localtime(now)
strTime = time.strftime("%Y-%m-%d", timeStruct)
gp_count = 1 #股票当天所有数据的保存编号
def mkdir(path): #股票保存路径函数
folder = os.path.exists(path)
if not folder: #判断是否存在文件夹如果不存在则创建为文件夹
os.makedirs(path) #makedirs 创建文件时如果路径不存在会创建这个路径
print(path)
def getData(url): #函数——从接口中获取单只股票当天每分钟的数据
content = ""
try: #网络会偶发出现奔溃情况,为了保证不中断和保证数据齐全,休息5秒重新执行
response = urllib.request.urlopen(url)
content = response.read().decode('utf-8')
except:
print("发生网络异常")
time.sleep(5)
return getData(url)
if content != "":
return content
else:
print("内容为空")
return getData(url)
def csv_create(path, msg): #函数——将单只股票的数据保存进指定文件夹
file = open(path,'w')
file.write(msg)
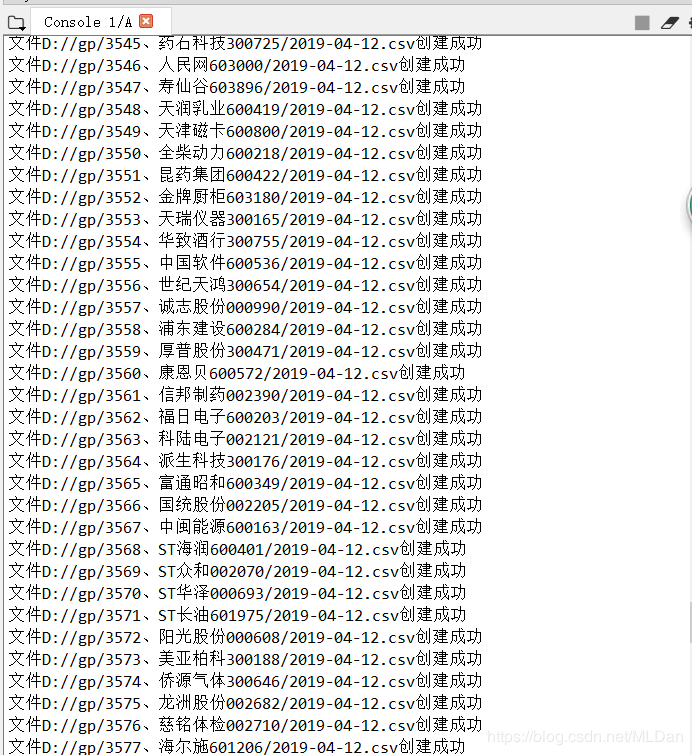
print("文件"+path+"创建成功")
file.close()
def tranformToCSV(content,filepath): #函数——将下载的数据转换为csv数据,以便读取
content = content.replace("(","").replace(")","")
json_str = json.loads(content)
a_str = json_str.get("data")
a_time = json_str.get("info").get("time")
a_date = str(a_time).split(" ")
mkdir(filepath)
array_str = np.array(a_str)
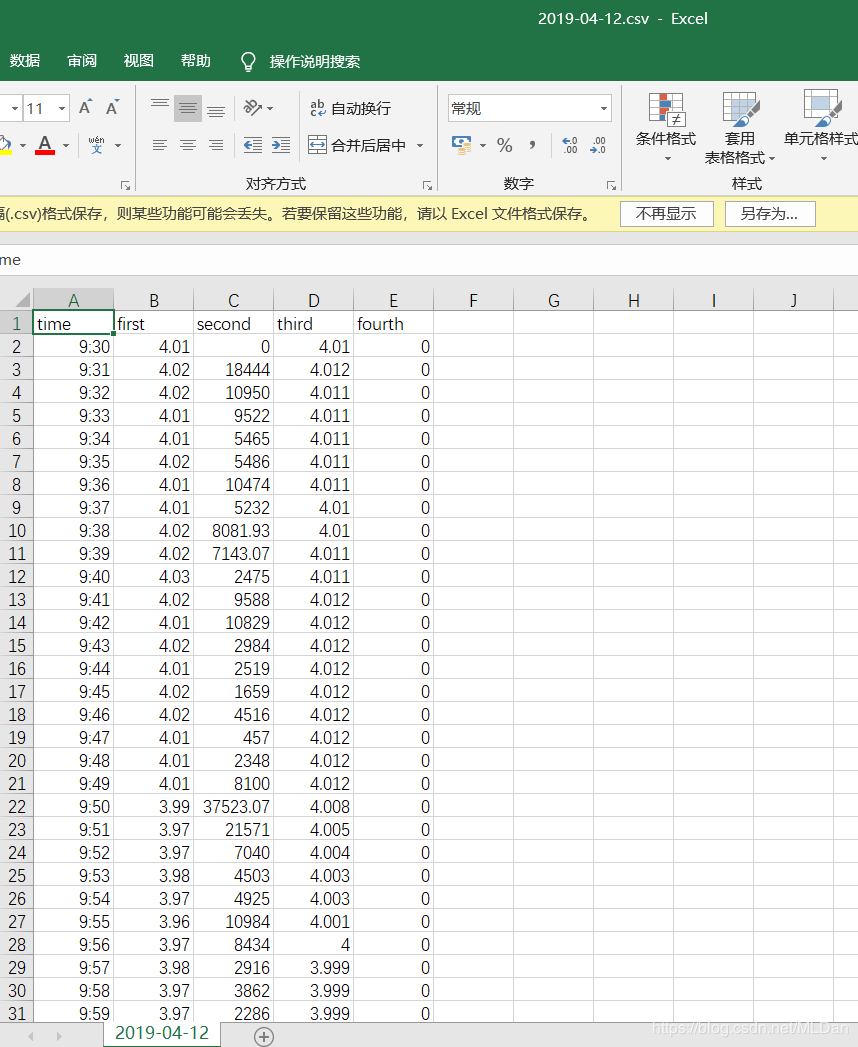
csv_str = "time,first,second,third,fourth\n" #time为当天时间点,first为该分钟股票价格
for item in array_str:
item = str(item)
items = item.split(",")
itemss = (str(items[0])).split(" ")
items0 = itemss[1]
csv_str += '"'+items0+'",'+items[1]+','+items[2]+','+items[3]+','+items[4]+'\n'
csv_create(filepath+"/"+a_date[0]+".csv",csv_str)
for item in arr:
url = "http://pdfm.eastmoney.com/EM_UBG_PDTI_Fast/api/js?rtntype=5&id="+item[3]+item[1]+"&type=r&iscr=false"
data = getData(url)
item2 = item[2].replace("*","")
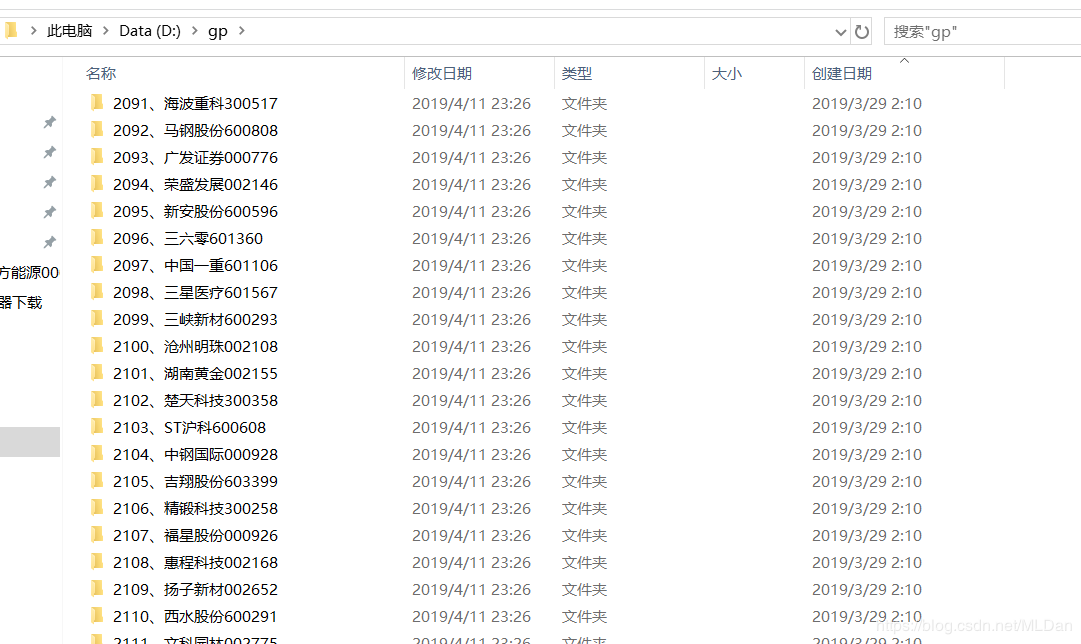
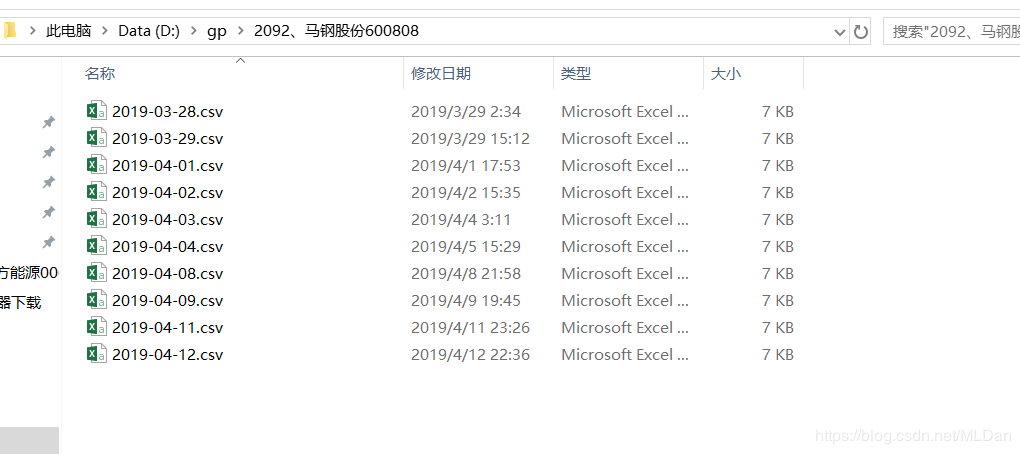
tranformToCSV(data,"D://gp/"+str(gp_count)+"、"+item2+item[3]) #股票信息的保存路径是(D://pg/序号+股票名字+股票代号/日期.csv)
gp_count = gp_count+1;
# 使用 DebugLog
db.commit()
db.close()get_gp_detail.py程序正确运行之后,D盘中将会出现我们所需要的数据,如下图:
3、对数据进行简单呈现plt_show.py:
import pandas as pd
import numpy as np
import matplotlib.pyplot as plt
o=open('D:/gp/1045、广州港601228/2019-04-01.csv')
table = pd.read_csv(o)
plt.plot(table['time'], table['first'])
plt.rcParams['figure.figsize'] = (30.0, 20.0)
plt.show()
pd.to_numeric(table["first"],errors="ignore")
#print(table["first"])
max = np.argmax(table["first"],axis=1)
min = np.argmin(table["first"],axis=0)
wave_price = table["first"][max]-table["first"][min]
wave_price_rate = wave_price/table["first"][0]
final_wave_price = table["first"][240]-table["first"][0]
final_wave_price_rate = final_wave_price/table['first'][0]
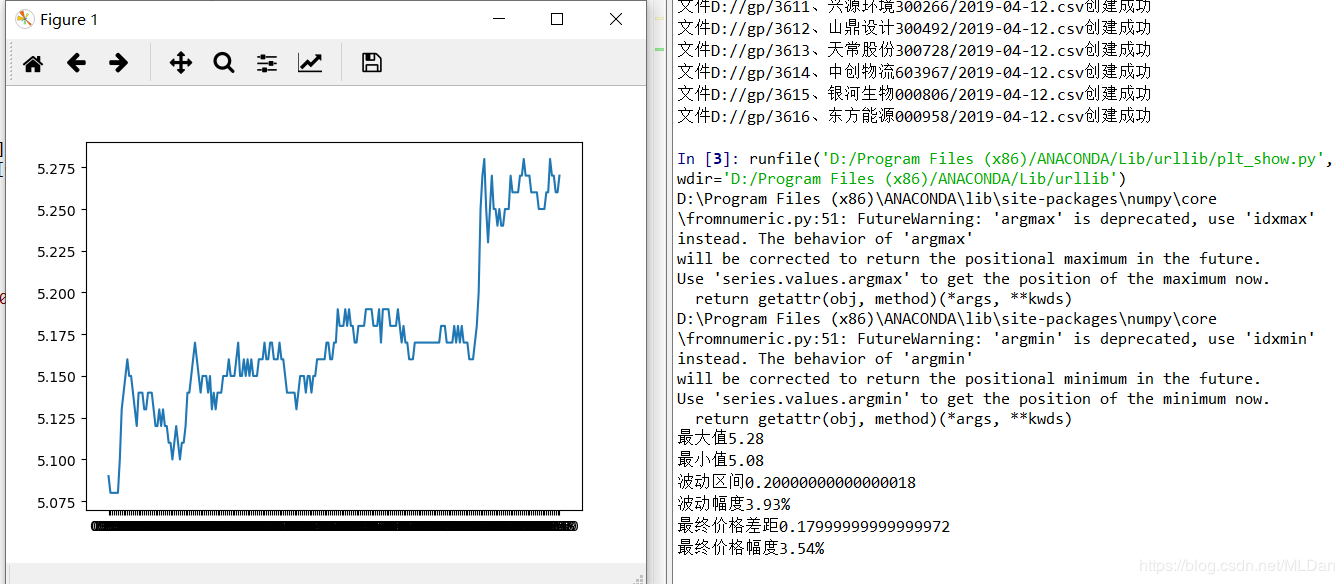
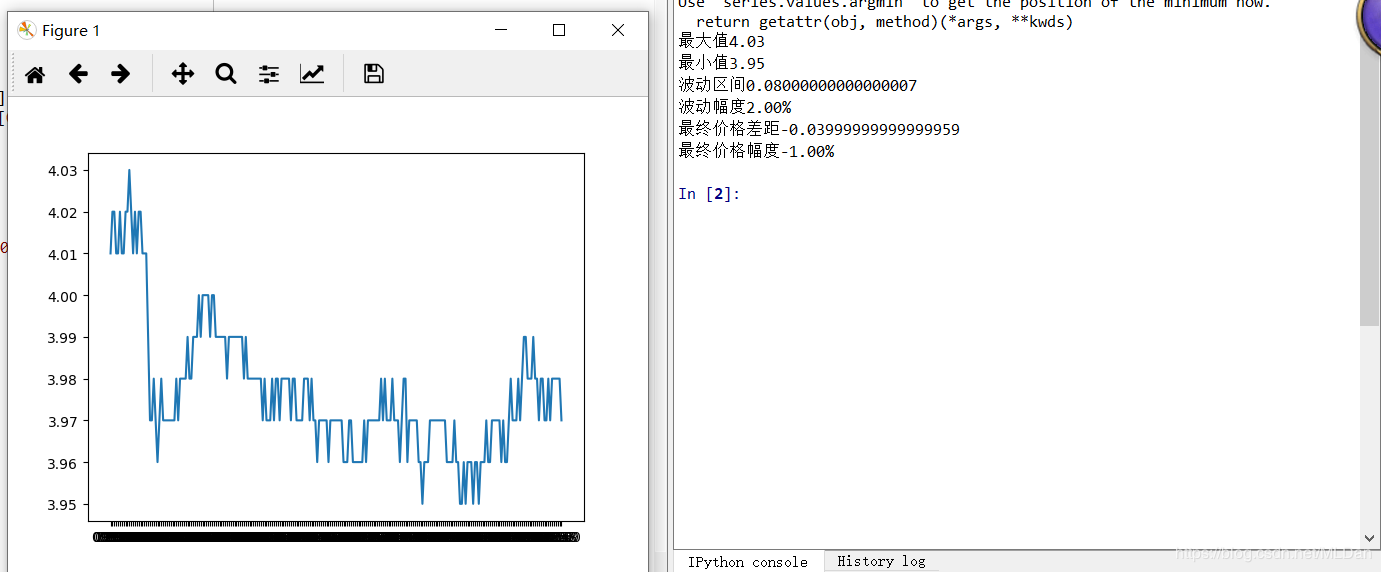
print("最大值"+str(table["first"][max]))
print("最小值"+str(table["first"][min]))
print("波动区间"+str(wave_price))
print("波动幅度%.2f%%"% (wave_price_rate * 100))
print("最终价格差距"+str(final_wave_price))
print('最终价格幅度%.2f%%' % (final_wave_price_rate * 100))效果图:
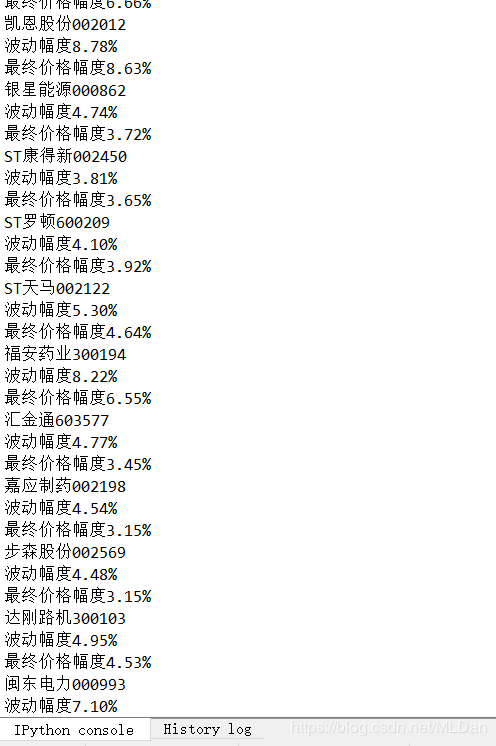
4、对所有股票数据进行简单的筛选和分析,筛选出2019-04-12,当天下午两点到三点之间,突然拉伸超过3%的所有股票并且保存进数据库find_feature.py:
import pymysql
import pandas as pd
import numpy as np
import matplotlib.pyplot as plt
#连接数据库
db = pymysql.connect(host='127.0.0.1',user='root',password='root',db='gp_db',port=3306)
#获取cursor
cursor = db.cursor()
time = "2019-04-12"
def find_feature(path,name,gpid):
    o=open(path)
    table = pd.read_csv(o)
    table['time'] = pd.to_datetime(table["time"])
    table = table.set_index('time',drop=False)     #排序之后,日期会是当前日期加上时间
    table = table["2019-04-12 14:00:00":"2019-04-12 15:00:00"]
    #print(table)
    if(table['first'].empty):
        return
    try:
        #print(table['first'])
        max = np.argmax(table["first"])
        min = np.argmin(table["first"])

        wave_price = table["first"][max]-table["first"][min]
        final_wave_price = table["first"][60]-table["first"][0]
        wave_price_rate = 0
        final_wave_price_rate = 0
        if table["first"][0] != 0:
            wave_price_rate = wave_price/table["first"][0]
            final_wave_price_rate = final_wave_price/table['first'][0]
        if  final_wave_price_rate > 0.03:
            print(name+gpid)
            print("波动幅度%.2f%%"% (wave_price_rate * 100))
            print('最终价格幅度%.2f%%' % (final_wave_price_rate * 100))
            cursor.execute('insert into special_gp(gpfeature,gpname,gpid,gptime) values(%s,%s,%s,%s)',(1,str(gp_count)+"、"+name,gpid,time))
    except:
        pass

sql = "select * from gp"
cursor.execute(sql)
print("SELECT OK")
#all_gp = cursor.fetchmany(1)
all_gp = cursor.fetchall()
arr = np.array(all_gp)
gp_count = 1

for item in arr:
    item2 = item[2].replace("*","")
    path = "D://gp/"+str(gp_count)+"、"+item2+item[3]+"/"+time+".csv"
    find_feature(path,item2,item[3])
    gp_count = gp_count+1;
db.commit()
db.close()
效果图:
以上即为股票当天数据爬取及数据分析,注意:每天股票的详细数据必须在第二天开市之前进行抓取,否则便再也抓取不到。
本实例支付的费用只是购买源码的费用,如有疑问欢迎在文末留言交流,如需作者在线代码指导、定制等,在作者开启付费服务后,可以点击“购买服务”进行实时联系,请知悉,谢谢
手机上随时阅读、收藏该文章 ?请扫下方二维码